Where homeowners’ insurance fits within the Massachusetts insurance marketplace
Massachusetts homeowners’ insurers had a total of $2.7 billion in written premium for the calendar year 2020, making it the second-largest line of insurance in the state. This amount was a 2% increase over the amount of premium reported for the calendar year 2019. In total, there are 90 licensed home insurance companies currently doing business in the Commonwealth.
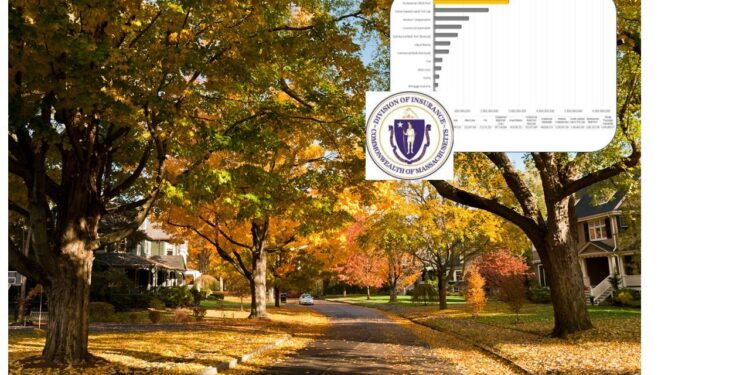
The following chart highlights the homeowners insurance lines and its place within the Massachusetts insurance industry.
Why the Division of Insurance publishes an annual Home Insurance Report
Published since 1996, the Division of Insurance is required to produce an annual home insurance report pursuant to M.G.L. c. 175 Sec. 4A & 4B. This year’s report relies on aggregate data provided by insurers and statistical agents with respect to the calendar years 2018, 2019, and 2020, which is then sorted by zip code and ISO territories. While the report may include data applying to all home insurance policies in the Commonwealth, the majority of data presented comes from the top 25 largest home insurers in Massachusetts and the FAIR Plan. This year’s report takes a look at this marketplace for the calendar year 2020.
Unlike private passenger auto insurance in Massachusetts, there are no specific laws requiring that a property owner have home insurance. Notwithstanding that fact, however, homeowner’s insurance is the second-largest line of Property and Casualty coverage in the Commonwealth (after state-mandated personal auto insurance).
Did homeowners’ insurance policies increase or decrease during the year?
The number of homeowners’ insurance policies increased overall, but not by a lot. According to the DOI, the total number of home insurance policies rose by approximately 8,760 policies from 2019 to 2020, or from 2,048,711 to 2,057,471. This works out to a percentage increase of 0.43%, and reflects a much smaller increase than in past years. In comparison, between the years 2018 and 2019, the increase was by approximately 29,099 home insurance policies.
Agency Checklists compiled the following chart on the total amount of home insurance policies by year based on a combination of data from the Home Insurance Report it has reviewed over the past five years.
Total number of policies by type of coverage
As stated above, the total number of homeowners insurance policies increased by 8,760 from 2019 to 2020. Breaking that down by type of policy, the DOI noted that while tenant and condominium policies increased by 24,150, single homeowner’s policies decreased by 15,389. The following chart highlights the differences between these three types of policies from 2017 through 2022.
Total premium by type of coverage
In Massachusetts, policies issued in the home insurance market cover “..non-commercial property for the risks of damage to structural and personal property as well as for the risk of personal liability claims” and are comprised of three major types of home insurance policies: condominium, traditional homeowners, and rental insurance.
The following chart using data from the Division of Insurance, takes a look at the total premium by type of coverage for the Tenant, Condo, and single Homeowner’s markets. While total premium increased slightly for both the Homeowners and Condominium markets, it decreased slightly for Tenants.
More to come on the Annual Home Insurance Report in the coming weeks
As Agency Checklists has done for the past few years, it will break the report up into a four-part series, focusing on different data published in the report. The coming weeks will see further articles on the state of FAIR Plan, home insurance coverage by counties, the impact of auto insurance and flood insurance on this market as well as financial results from the report.


