The 2018 Camp Fire in Northern California left behind devastation in many forms: burned-out businesses, incinerated homes, charred cars. In total, the fire destroyed nearly 19,000 structures and claimed the lives of 85 people. The blaze also caused another casualty: A regional insurer was forced into liquidation in part because it had taken on too much risk in areas affected by the fire.
The Camp Fire was extraordinary in its scale. It highlighted the fact that wildfires are becoming increasingly destructive and difficult to model using traditional, historical data-driven methods. But wildfires are just the beginning. Much like a hurricane, flood, earthquake, mudslide or tsunami, the Camp Fire inflicted severe damage on a specific area, and research indicates that natural disasters like these are increasing in frequency and severity.
Evolving natural disaster risk reveals a less obvious yet far-reaching consequence for insurers: Traditional methods of managing risk concentration can’t keep up with a constantly changing risk landscape.
Whenever a natural disaster strikes, an insurer with policies covering the affected area can be responsible for paying out tremendous amounts of money in a short period. Depending on the severity of the damage and the insurer’s concentration of risk, the insurer could face collapse.
In the wake of major disasters, state insurance regulators often issue rules limiting insurers’ ability to take underwriting action. California instituted a one-year moratorium on dropping customers after the Camp Fire. While rules like this help protect customers who’ve suffered loss, insurers may end up continuing to carry risk in a certain area longer than it makes financial sense to do so.
Given these realities, understanding, visualizing and managing the concentration of risk is critical to the long-term viability of property and casualty insurers everywhere. While addressing risk concentration offers clear value, if you’re like most insurers, your employees don’t have the time to learn geographic information systems (GIS) software, build maps/GIS visualizations and interpret them.
Fortunately, forward-thinking insurers are investing in innovative tools that can help manage the concentration of risk in real-time. Using dynamic, data-driven mapping applications, savvy insurers are better-assessing risk and making more informed decisions for their business and policyholders.
Since many insurers don’t proactively manage concentration of risk related to natural disasters, they often rely on reinsurers to help them manage risk saturations on a quarterly or annual basis. A reinsurance review will typically reveal high concentrations of risk, and if the reinsurer spots a potential problem, it may elect to take on less risk than the insurer needs to stay adequately protected. The insurer would then have two choices: Go without full reinsurance coverage or find another way to manage the saturation, such as not renewing policies.
Neither of these options is ideal, but they’ve long been sufficient. Now, though, as natural disasters evolve, the limitations of looking at risk concentration infrequently and only through the lens of the reinsurer have a larger potential impact. When insurers don’t regularly and proactively manage risk saturation themselves, two vulnerabilities emerge.
What’s the root cause of these problems? Perhaps the largest one is that proactively managing risk saturation is difficult without the right tools. Spreadsheets are many data analysts’ best friends, but they’re not the ideal tool for assessing, measuring and managing geospatial data.
Additionally, traditional divisions of labor within insurance companies can make measuring and managing risk concentration even more difficult. Underwriters must often make decisions within a business day, or perhaps within just an hour or two, leaving them little time to submit a request for data to an analytics or actuarial team and then wait for the results. Analytics and actuarial teams have their own strategic priorities and may not have capacity to fill requests or conduct concentration of risk analyses.
The good news is that, with the right tools, property insurers can efficiently and accurately understand their concentration of risk and take action to address it before it becomes a potential problem.
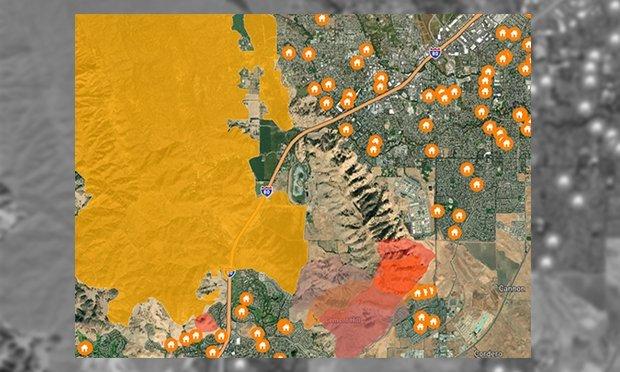
Today, underwriters can gain real-time insight into concentration of risk, as well as many other valuable geospatial data factors, using dynamic, data-powered mapping tools customized to existing books of business. These interactive tools, or “mapplications,” work intuitively, similar to popular mapping apps we’ve all used to get directions or locate a destination.
Maps like these offer virtually real-time visibility into your book of business and provide quick, easy-to-use but highly valuable information for insurers looking to manage risk concentration. Insurers can measure and manage concentration of risk without adding multiple employees or overhauling current workflows. By giving decision-makers the tools to visualize where risk is accumulating as they make decisions, they can efficiently help prevent problematic risk concentration.
When you better understand your concentration of risk related to a natural disaster or other risk, you can more easily overcome the challenges described earlier, including protecting your business from severe negative financial consequences. But there are other benefits you can reap, too.
Whether you’ve long worried about the concentration of risk lurking in your portfolio or are just starting to scratch the surface when it comes to investing in dynamic data visualization, there are a variety of tools available that can provide the right data at the right time and ultimately, lead to better business decisions.
Bryan Stanwood, CPCU, ARM, AIDA, is vice president and chief experience officer for WSRB and BuildingMetrix. He has 30+ years of property and casualty insurance experience and extensive expertise in managing high-performing insurance sales and underwriting departments.
The opinions expressed here are the author’s own.
A version of this article originally appeared on the BuildingMetrix website. It is reprinted here with permission.